Prometheus Monitoring with Golang

Sebastian Pawlaczyk

Prometheus Monitoring with Golang
When developing software, the initial goal is often to deliver a Minimum Viable Product (MVP), and that’s perfectly fine for the early stages. However, this article is aimed at projects that have moved beyond the MVP phase and are now in production, where traffic is increasing, and stability becomes crucial.
Whether your application is structured as a monolith or a distributed microservice architecture, the absence of robust monitoring and alerting mechanisms can lead to serious issues, including undetected failures or degraded performance.
I will explore the critical role of monitoring and provide a step-by-step guide on integrating Prometheus into your Golang project.
Prometheus
Two words: Metrics and Alerting — that’s Prometheus in a nutshell. It’s an open-source system built to collect, store, and query time-series data, making it a go-to solution for monitoring and understanding your application’s performance.
Metric Types:
Prometheus uses four main types of metrics, each designed for a specific purpose in tracking and analyzing system health:
1. Counter
A counter is a metric that keeps track of a value that only goes up (or resets to zero when restarted). It’s great for tracking things like the number of HTTP requests or total errors.
Example: http_requests_total - A counter that tracks the total number of HTTP requests served.
2. Gauge
Captures values that can fluctuate up or down. It’s used to track things like statuses, memory usage, or the number of active connections.
Example: node_memory_usage_bytes - A gauge that tracks the current memory usage.
3. Histogram
A histogram is a metric that tracks the distribution of values, showing how often different ranges of values occur. It’s useful for measuring things like request durations or response sizes.
Example: http_request_duration_seconds - A histogram that measures the duration of HTTP requests, split into predefined buckets (e.g., 0.1s, 0.2s, etc.).
4. Summary
Similar to histograms but provides statistics like averages and percentiles.
Example: http_response_size_bytes - A summary that tracks the size of HTTP responses.
Metric Format:
Each metric in Prometheus has a unique name and can include a set of labels (key-value pairs) to distinguish different dimensions of the same metric. For example, an HTTP request counter might have labels for method and status_code to track different types of requests.
http_requests_total{method="GET", status="200"} 1234Setup Golang Project with Prometheus
In this section, I will walk through the step-by-step process of integrating Prometheus into a Golang project. I will start by setting up basic metrics and exposing them for Prometheus to scrape, and then show how to connect the setup with Grafana for visualizing the collected data.
Getting Prometheus Golang Client
To begin, add the Prometheus client libraries to your project using the following commands:
go get github.com/prometheus/client_golang/prometheus
go get github.com/prometheus/client_golang/prometheus/promauto
go get github.com/prometheus/client_golang/prometheus/promhttp
Configure the HTTP Server for Scraping
- Prometheus collects metrics by scraping a /metrics
- If you create metrics using the core prometheus package, you need to register them with a prometheus.Registerer. If not registered, your metrics will not be exposed.
package main

import (
    "github.com/prometheus/client_golang/prometheus"
    "github.com/prometheus/client_golang/prometheus/promauto"
    "github.com/prometheus/client_golang/prometheus/promhttp"
    "log"
    "math/rand"
    "net/http"
    "time"
)

var (
    counter = promauto.NewCounter(prometheus.CounterOpts{
      Name: "devbulls_counter",
      Help: "Counting the total number of requests handled",
    })

    // must be registered
    gauge = prometheus.NewGaugeVec(prometheus.GaugeOpts{
      Name: "devbulls_gauge",
      Help: "Monitoring node usage",
    }, []string{"node", "namespace"})
)

func recordMetrics() {
    go func() {
      for {
        counter.Inc()
        gauge.WithLabelValues("node-1", "namespace-b").Set(rand.Float64())
        time.Sleep(time.Second * 5)
      }
    }()
}

func init() {
    prometheus.MustRegister(gauge)
}

func main() {
    recordMetrics()

    srv := http.NewServeMux()
    srv.Handle("/metrics", promhttp.Handler())

    if err := http.ListenAndServe(":8090", srv); err != nil {
        log.Fatalf("unable to start server: %v", err)
    }
}- Run the program:
go run main.go- Then, use curl to check the metrics:
curl http://localhost:8090/metrics- You should see the similar metrics output:
# HELP devbulls_counter Counting the total number of requests handled
# TYPE devbulls_counter counter
devbulls_counter 3
# HELP devbulls_gauge Monitoring node usage
# TYPE devbulls_gauge gauge
devbulls_gauge{namespace="namespace-b",node="node-1"} 0.9888641753103984
Running Prometheus
To set up Prometheus locally using Docker, follow these steps:
- Inside docker-compose.yaml configure basic Prometheus instance using the prom/prometheus image. It maps port 9090 and uses the custom prometheus.yaml configuration file for scraping targets.
services:
  prometheus:
    image: prom/prometheus:latest
    volumes:
      - ./prometheus.yaml:/etc/prometheus/prometheus.yml
    ports:
      - '9090:9090'
    networks:
      - monitoring
    command:
      - '--config.file=/etc/prometheus/prometheus.yml'

networks:
  monitoring:
driver: bridge- Create a configuration file prometheus.yaml, where you define your targets and scraping intervals. If you run your Golang server locally, use host.docker.internal as the target; if it’s inside a Docker container, use the container-name instead.
global:
  scrape_interval: 15s

scrape_configs:
  - job_name: 'myapp'
    scrape_interval: 10s
    static_configs:
      - targets:
- 'host.docker.internal:8090' # or container-name:8090- Run docker-compose, and then navigate to http://localhost:9090 in your browser to check the status of your targets:
docker-compose up -d
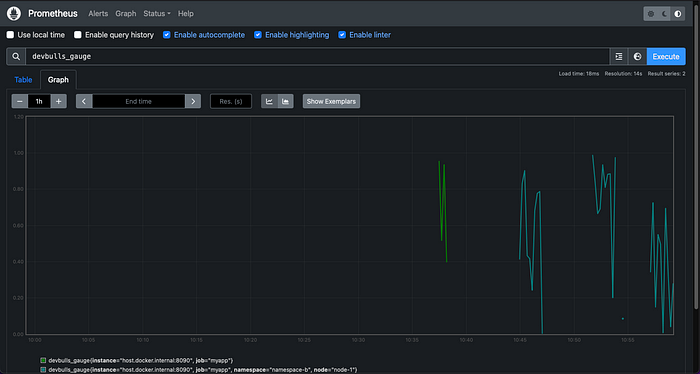
- Search your metrics:
Integrating with Grafana
To visualize your metrics, set up Grafana using Docker:
- Update your docker-compose.yaml with grafana/grafana image.
services:
  grafana:
    image: grafana/grafana:latest
    container_name: grafana
    ports:
      - "3000:3000"
    environment:
      - GF_SECURITY_ADMIN_PASSWORD=admin
    networks:
      - monitoring
    depends_on:
- prometheus- Rerun docker-compose and navigate to http://localhost:3000.
Username: admin
Password: admin
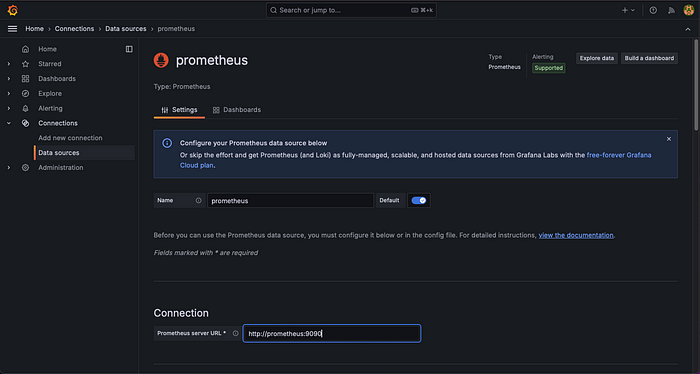
- Add a new data source and select Prometheus as the source. Enter the URL http://prometheus:9090 to connect to your Prometheus instance.
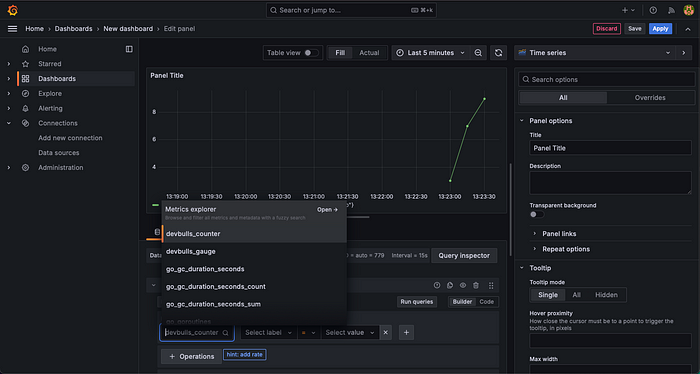
- Use the Grafana UI to create a new dashboard and add panels to visualize your Prometheus metrics.
Conclusions
Monitoring is essential for any software where stability and performance are priorities. Integrating Prometheus is a reliable way to ensure visibility into your system’s health. Additionally, combining it with OpenTelemetry is becoming increasingly popular for gaining even deeper insights into distributed systems.


.svg)


.svg)
.svg)
.svg)